BTC
Bitcoin (BTC)
$117,693.80 ▲ 0.99%
ETH
Ethereum (ETH)
$2,963.44 ▲ 0.01%
XRP
XRP (XRP)
$2.81 ▲ 8.65%
USDT
Tether (USDT)
$1.00 ▲ 0.02%
BNB
BNB (BNB)
$693.84 ▲ 0.56%
SOL
Solana (SOL)
$163.39 ▼ -0.95%
USDC
USDC (USDC)
$0.99994157 ▲ 0.01%
DOGE
Dogecoin (DOGE)
$0.20496293 ▲ 3.41%
TRX
TRON (TRX)
$0.30485666 ▲ 3.39%
ADA
Cardano (ADA)
$0.73343688 ▲ 6.53%
stETH
Lido Staked Ether (stETH)
$2,963.31 ▲ 0.12%
HYPE
Hyperliquid (HYPE)
$46.42 ▲ 5.24%
WBTC
Wrapped Bitcoin (WBTC)
$117,475.71 ▲ 0.94%
SUI
Sui (SUI)
$3.45 ▼ -0.83%
XLM
Stellar (XLM)
$0.38960480 ▲ 27.45%
LINK
ChainLink (LINK)
$15.42 ▲ 0.06%
BCH
Bitcoin Cash (BCH)
$531.55 ▲ 2.05%
AVAX
Avalanche (AVAX)
$20.96 ▲ 0.37%
HBAR
Hedera (HBAR)
$0.19933913 ▲ 0.18%
LEO
UNUS SED LEO (LEO)
$9.07 ▲ 0.44%
SHIB
SHIBA INU (SHIB)
$0.00001347 ▼ -0.73%
weETH
Wrapped eETH (weETH)
$3,175.67 ▲ 0.06%
USDS
USDS (USDS)
$0.99998031 ▼ -0.09%
TON
Toncoin (TON)
$3.00 ▲ 0.96%
LTC
Litecoin (LTC)
$95.12 ▼ -0.58%
DOT
Polkadot (DOT)
$3.99 ▲ 1.73%
XMR
Monero (XMR)
$333.22 ▲ 1.45%
PEPE
Pepe (PEPE)
$0.00001249 ▼ -1.22%
BGB
Bitget Token (BGB)
$4.51 ▼ -2.21%
USDe
Ethena USDe (USDe)
$1.00 ▲ 0.00%
UNI
Uniswap (UNI)
$8.79 ▲ 4.15%
AAVE
Aave (AAVE)
$301.54 ▼ -1.97%
DAI
Dai (DAI)
$1.00 ▲ 0.01%
PI
Pi Network (PI)
$0.47152878 ▼ -9.97%
TAO
Bittensor (TAO)
$400.26 ▲ 5.36%
APT
Aptos (APT)
$4.92 ▼ -0.40%
NEAR
Near Protocol (NEAR)
$2.54 ▼ -0.54%
CRO
Cronos (CRO)
$0.10857894 ▲ 11.94%
OKB
OKB (OKB)
$48.98 ▼ -0.79%
ICP
Internet Computer (ICP)
$5.42 ▼ -1.14%
ONDO
Ondo Finance (ONDO)
$0.90277312 ▼ -0.27%
JitoSOL
Jito Staked SOL (JitoSOL)
$198.80 ▼ -0.74%
ETC
Ethereum Classic (ETC)
$18.44 ▼ -0.69%
KAS
Kaspa (KAS)
$0.08705969 ▼ -0.08%
USD1
USD1 (USD1)
$1.00 ▲ 0.01%
ENA
Ethena (ENA)
$0.33731347 ▲ 3.48%
ATOM
Cosmos Hub (ATOM)
$4.69 ▲ 0.72%
VET
VeChain (VET)
$0.02443807 ▲ 0.10%
MNT
Mantle (MNT)
$0.62160691 ▼ -1.68%
POL
POL (ex-MATIC) (POL)
$0.23259061 ▲ 3.26%
ARB
Arbitrum (ARB)
$0.40977977 ▲ 0.00%
TRUMP
OFFICIAL TRUMP (TRUMP)
$9.92 ▼ -2.05%
GT
GateToken (GT)
$16.31 ▲ 0.03%
ALGO
Algorand (ALGO)
$0.22431238 ▲ 2.19%
RENDER
Render (RENDER)
$3.69 ▼ -1.88%
FET
Artificial Superintelligence Alliance (FET)
$0.72380507 ▼ -2.54%
FTN
Fasttoken (FTN)
$4.45 ▼ -0.32%
SEI
Sei (SEI)
$0.33263869 ▼ -0.10%
FIL
Filecoin (FIL)
$2.59 ▼ -0.40%
SKY
Sky (SKY)
$0.07993099 ▼ -5.41%
BONK
Bonk (BONK)
$0.00002262 ▼ -5.97%
MKR
Maker (MKR)
$1,916.45 ▼ -5.18%
WLD
World (WLD)
$1.05 ▼ -3.40%
QNT
Quant (QNT)
$116.47 ▼ -0.27%
SPX
SPX6900 (SPX)
$1.64 ▼ -0.89%
JUP
Jupiter (JUP)
$0.48917509 ▼ -0.58%
FDUSD
First Digital USD (FDUSD)
$0.99830339 ▼ -0.01%
KCS
KuCoin Token (KCS)
$11.49 ▲ 1.08%
TIA
Celestia (TIA)
$1.94 ▲ 2.33%
FORM
Four (FORM)
$3.32 ▲ 6.82%
PENGU
Pudgy Penguins (PENGU)
$0.02364299 ▲ 14.45%
Fartcoin
Fartcoin (Fartcoin)
$1.28 ▼ -3.12%
NEXO
Nexo (NEXO)
$1.28 ▲ 0.47%
INJ
Injective (INJ)
$12.72 ▲ 2.46%
FLR
Flare (FLR)
$0.01716324 ▲ 1.43%
OP
Optimism (OP)
$0.66353681 ▼ -1.77%
XDC
XDC Network (XDC)
$0.07075209 ▼ -3.45%
VIRTUAL
Virtuals Protocol (VIRTUAL)
$1.75 ▼ -2.65%
STX
Stacks (STX)
$0.75189321 ▲ 0.13%
S
Sonic (S)
$0.36329878 ▲ 5.91%
IP
Story Protocol (IP)
$4.76 ▲ 36.51%
mETH
Mantle Staked Ether (mETH)
$3,169.50 ▲ 0.17%
WIF
dogwifhat (WIF)
$0.98061513 ▼ -7.18%
GRT
The Graph (GRT)
$0.09718287 ▼ -1.38%
FLOKI
FLOKI (FLOKI)
$0.00009586 ▼ -7.41%
IMX
Immutable (IMX)
$0.50697224 ▲ 1.62%
PAXG
PAX Gold (PAXG)
$3,350.75 ▲ 0.59%
KAIA
Kaia (KAIA)
$0.16117188 ▼ -0.66%
PYUSD
PayPal USD (PYUSD)
$0.99899888 ▲ 0.06%
CRV
Curve DAO (CRV)
$0.63216553 ▲ 2.79%
CAKE
PancakeSwap (CAKE)
$2.50 ▼ -0.91%
A
Vaulta (A)
$0.54288521 ▼ -0.46%
XAUT
Tether Gold (XAUT)
$3,350.92 ▲ 0.69%
mSOL
Marinade Staked SOL (mSOL)
$214.18 ▼ -0.66%
THETA
Theta Network (THETA)
$0.80069316 ▼ -0.42%
GALA
Gala (GALA)
$0.01733248 ▲ 0.62%
LDO
Lido (LDO)
$0.84417346 ▼ -0.88%
RAY
Raydium (RAY)
$2.71 ▼ -0.71%
IOTA
IOTA (IOTA)
$0.19456379 ▲ 5.80%
IOTA
IOTA (IOTA)
$0.19456379 ▲ 5.80%
to-top

Pepe Coin price forms a risky pattern as whale selling intensifies

Pepe Coin’s price remains under pressure this week and is at risk of further downside after the token formed a descending triangle pattern and as selling intensifies. Pepe (PEPE), the third-biggest meme coin after Dogecoin and Shiba Inu, fell to…

Pepe Coin’s price remains under pressure this week and is at risk of further downside after the token formed a descending triangle pattern and as selling intensifies.

Summary
  • Pepe Coin price has formed a giant descending triangle pattern on the daily chart.
  • Whale and smart money investors have continued selling the coin.
  • The futures open interest has plunged to a multi-month low.

Pepe (PEPE), the third-biggest meme coin after Dogecoin and Shiba Inu, fell to a low of $0.000009205, its lowest level since June 24. The token has tumbled by almost 50% from its highest level this year.

One of the main reasons Pepe’s price has tumbled is that whales have continued to sell the token heavily. They now hold 6.54 trillion tokens, down from 7.6 trillion tokens.

The same selling has continued among the so-called smart money investors, who now hold 1.62 trillion tokens, down from 2.6 trillion in August. Whale and smart-money selling is often seen as a bearish sign for a token, as these investors have a long track record of success in the crypto industry.

More metrics show that demand for Pepe tokens has continued to fall in the past few months. For example, futures open interest dropped to $557 million on Tuesday from $800 million earlier this month and more than $1 billion in July.

Falling open interest is usually a sign of low demand among investors. The same decline has also happened in the spot market, where daily volume has continued to fall in the past few months.

Pepe Coin price technical analysis 

Pepe Coin price
Pepe price chart | Source: crypto.news 

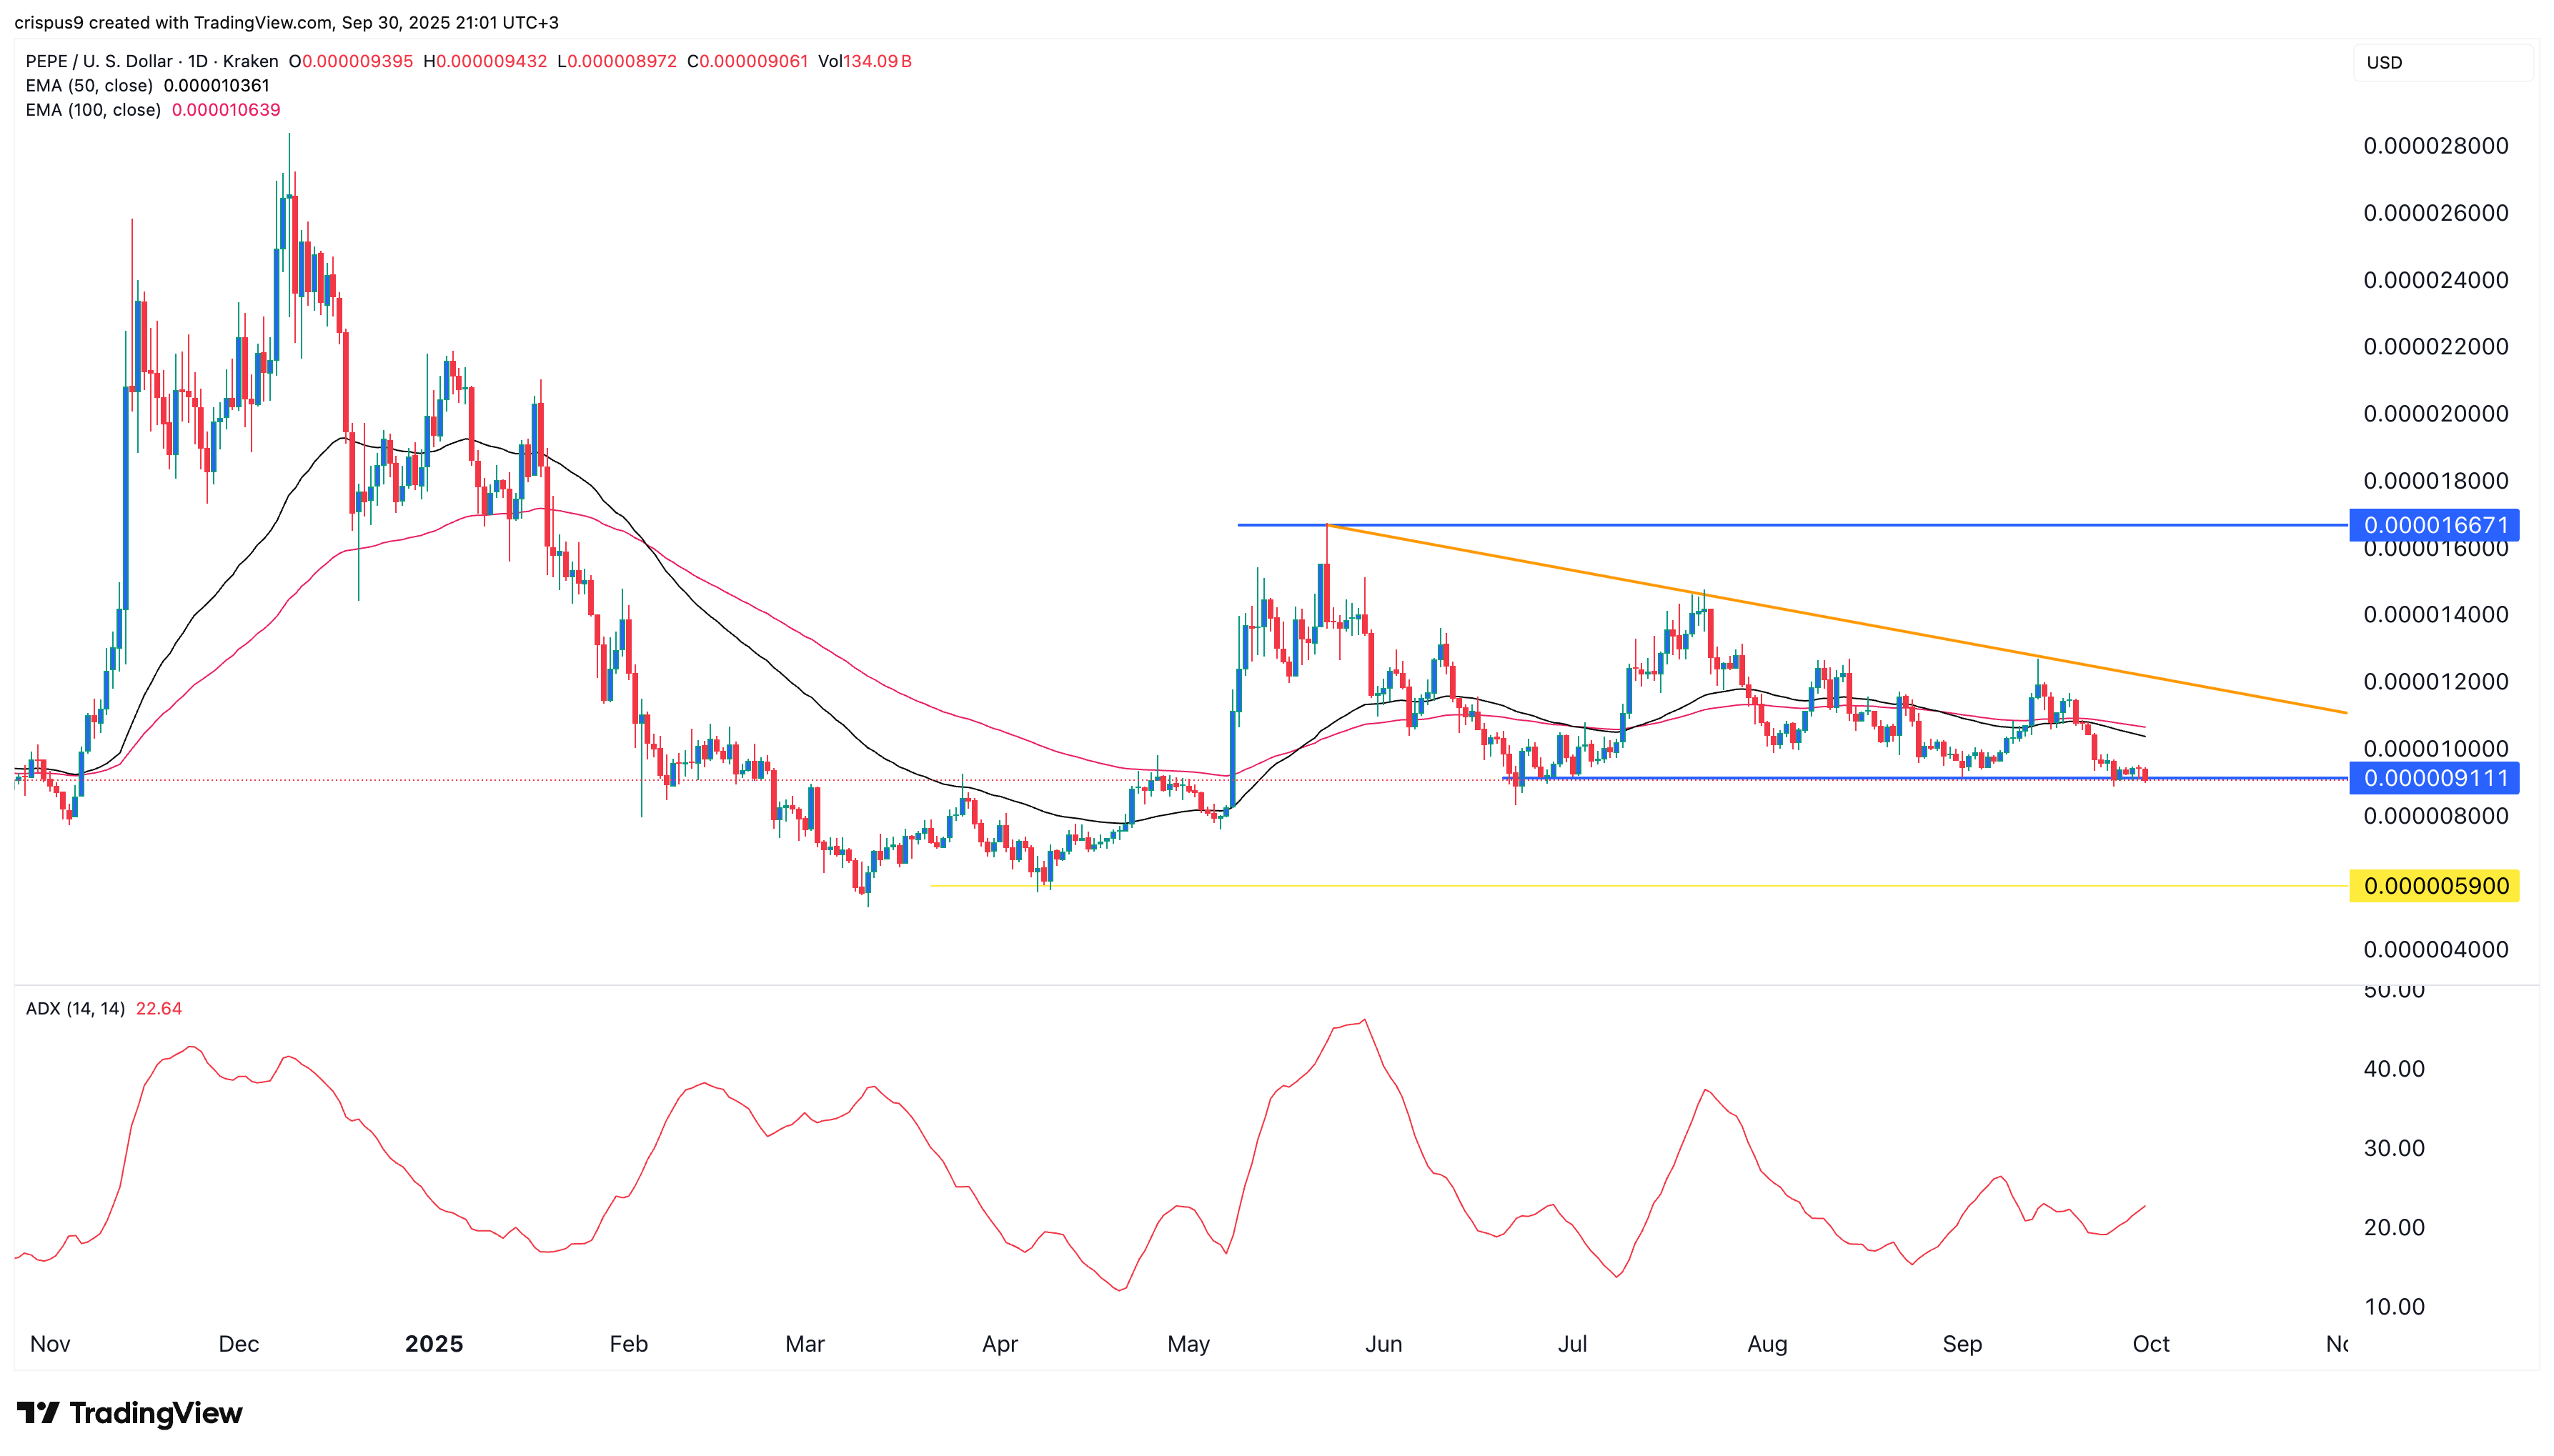
The daily timeframe chart shows that Pepe’s price has come under pressure in the past few months, falling from a high of $0.00001667 in May to a low of $0.0000091 today. This price is notable since it coincides with the horizontal line that connects the lowest swings since June this year.

Pepe has formed a descending triangle pattern, a common bearish continuation pattern made up of horizontal support and a descending trendline. In this case, the trendline connects the swing highs on May 22, July 22, and Sep. 13.

Pepe Coin’s price has moved below the 50-day and 100-day Exponential Moving Averages, while the Average Directional Index has risen, a sign that the retreat is gaining momentum.

Therefore, the coin will likely continue to fall as sellers target the next key support level at $0.0000059, the April 6 low.