


Trump’s tariffs: Boosting or hurting XRP price?
XRP has long been championed as the cross-border liquidity solution for the future of finance, but its price action is currently locked in a defensive battle as it struggles to decouple from the high-volatility risk asset narrative. This tension has…
XRP has long been championed as the cross-border liquidity solution for the future of finance, but its price action is currently locked in a defensive battle as it struggles to decouple from the high-volatility risk asset narrative.
This tension has only intensified as President Trump’s escalating tariff drama has triggered a market-wide risk-off sentiment. As investors pivot toward safety and away from digital assets, the question is, are these tariffs hurting XRP’s price action?
- XRP price has dropped nearly 12% since mid-January amid rising geopolitical tensions and renewed U.S. tariff threats.
- Market sentiment weakened after President Trump’s tariff warnings toward the EU and Canada triggered a risk-off shift across crypto.
- Despite price pressure, XRP network fundamentals remain strong with a fivefold rise in stablecoin liquidity and steady institutional ETF inflows.
Since April last year, investors have learned that the imposition of tariffs, which are essentially indirect taxes on consumers and businesses, can strongly affect market sentiment long before the actual desired effect from protectionist trade policies comes into fruition. The effect is similar to the way they alter investor psychology, which is to say that they tend to create a lot of tension and uncertainty in the markets without necessarily reflecting the final economic outcome of the negotiations.
The latest escalation of tariff episodes that followed this year came on Jan. 17 from U.S. President Donald Trump’s tariff threats directed towards its EU partners, should they fail to cooperate with his administration over its annexation of Greenland into the nation.
While the threat of a 10% levy was retracted just four days after a framework deal was reached to stabilize transatlantic relations, it was quickly followed by another stern warning towards Canada should the country proceed with a trade deal with China, accusing Canada of becoming a drop-off port for Chinese products.
Amidst this geopolitical friction that has continued to fuel fears of a global trade war unsettling investors, the crypto market bore the immediate brunt, dropping nearly 8% since its highest in mid-January this year.
This happened as investors liquidated their holdings in the crypto market to reallocate capital into traditional safe-haven assets such as precious metals like Gold and Silver that have increasingly grown their appeal among investors and have hit new highs recently as they continue to suck the liquidity out of the digital asset market.
XRP, for its part, has subtly followed the broader crypto market’s trajectory, dropping nearly 12% in the period and losing the key $2 psychological support level. At the same time, it backtracked the price gains towards levels observed at the beginning of this year.
Last year, the reciprocal tariffs announced by the U.S. on China and other key trading partners had played a much smaller role in XRP price as its losses were quickly erased owing to a regulatory win by Ripple, the issuer of XRP, in a long-standing legal battle with the SEC that boosted prices to fresh all-time highs by mid-year.
At press time, XRP (XRP) was trading at $1.88, a price closing in on the $1.79 level, which was last observed when markets retracted after the first round of tariffs against China was announced in April last year.
XRP fundamentals remain strong
Despite the macro uncertainty, fundamentals and on-chain metrics for XRP show that demand for the token has been steady.
Stablecoin liquidity on the XRP network has undergone a massive expansion, surging nearly fivefold from $85 million at the onset of the 2025 tariff tensions to $406 million today. This growth has been primarily fueled by Ripple’s RLUSD, which now commands a dominant 83% share of the network’s stablecoin ecosystem.
Price volatility also didn’t seem to deter long-term holders, according to recent market data. Figures from CoinGlass show that investors have moved XRP off exchanges for the majority of the period since the tariff escalation began. See below.
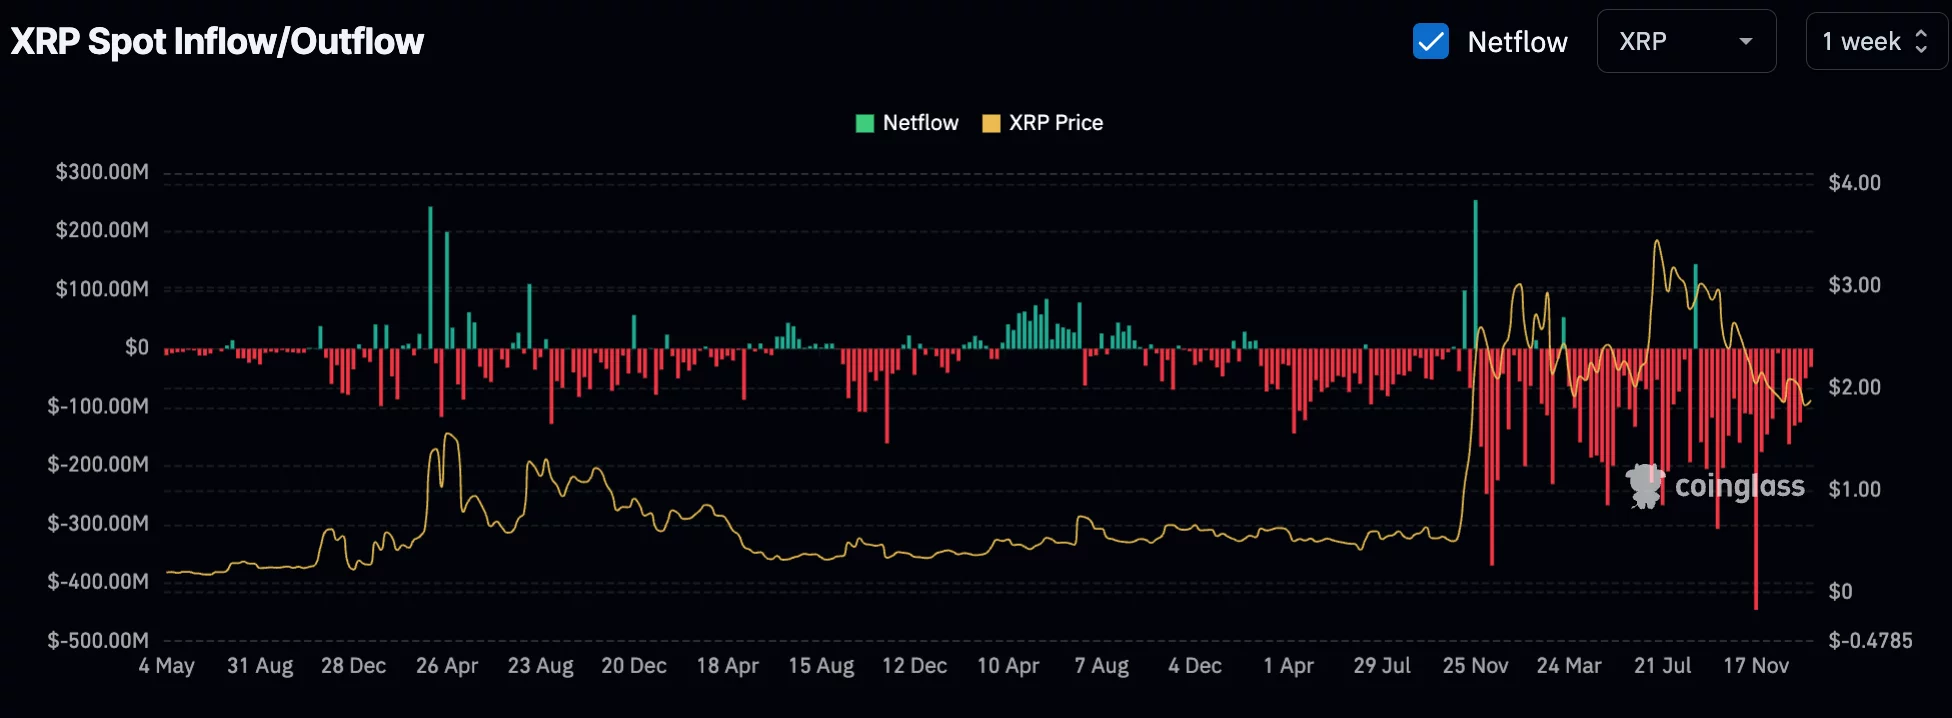
Meanwhile, institutional investors have also shown resilience. Data from SoSovalue show that U.S. spot XRP ETFs have recorded positive inflows on a monthly basis since their launch in November. These products have so far drawn in $1.26 billion in total net inflow.
What’s next for XRP price?
It is evident that XRP’s performance throughout this period was largely a reflection of overall market sentiment rather than a lack of internal utility.
If tariff drama escalates into a broader global trade conflict, it could risk further eroding investor sentiment and press the XRP price lower at least in the short term. On the other side, if tariffs can be used effectively as negotiating chips with many of their inflationary impacts softened by diplomatic resolutions, XRP will likely not suffer for long.
On the daily chart, XRP price action has been trading within a descending parallel channel pattern since mid-July last year. While the pattern usually means that prices would continue to move downwards, a successful breakout from the upper side of this pattern usually tends to lead to a bullish reversal in the related asset’s price.
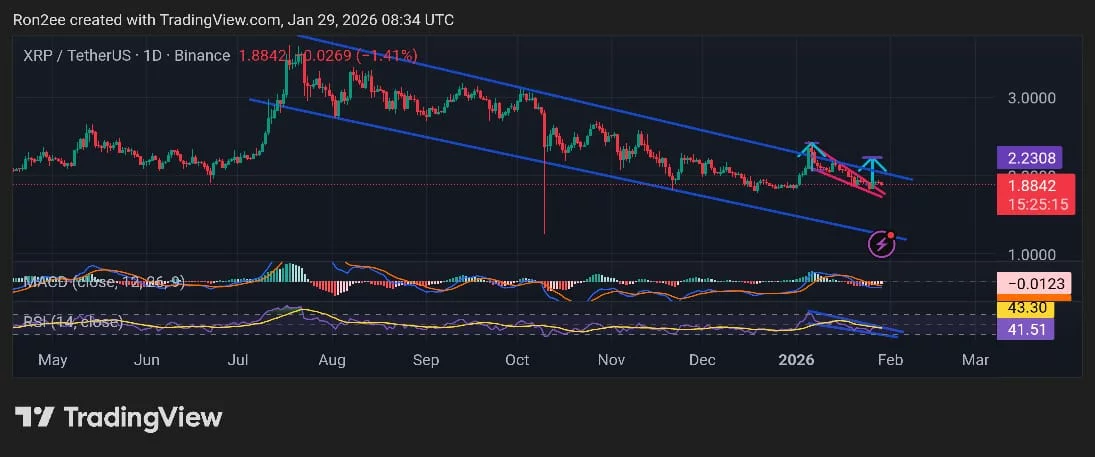
XRP bulls tried to lodge a breakout in early January as the entire crypto market rallied toward new yearly highs. It subsequently failed as profit-taking by investors and liquidations dragged the price significantly lower.
As this drop occurred, it formed a falling wedge pattern, another popular bullish reversal pattern in technical analysis. A breakout from the pattern could springboard the XRP price back above the $2 psychological resistance level to $2.23, the projected level based on the wedge breakout.
However, there could be some hiccups on the way as momentum indicators like the MACD and RSI show signs of exhaustion. Notably, the MACD lines were trending downwards while the RSI had formed a bearish divergence.
Disclosure: This article does not represent investment advice. The content and materials featured on this page are for educational purposes only.