BTC
Bitcoin (BTC)
$117,693.80 ▲ 0.99%
ETH
Ethereum (ETH)
$2,963.44 ▲ 0.01%
XRP
XRP (XRP)
$2.81 ▲ 8.65%
USDT
Tether (USDT)
$1.00 ▲ 0.02%
BNB
BNB (BNB)
$693.84 ▲ 0.56%
SOL
Solana (SOL)
$163.39 ▼ -0.95%
USDC
USDC (USDC)
$0.99994157 ▲ 0.01%
DOGE
Dogecoin (DOGE)
$0.20496293 ▲ 3.41%
TRX
TRON (TRX)
$0.30485666 ▲ 3.39%
ADA
Cardano (ADA)
$0.73343688 ▲ 6.53%
stETH
Lido Staked Ether (stETH)
$2,963.31 ▲ 0.12%
HYPE
Hyperliquid (HYPE)
$46.42 ▲ 5.24%
WBTC
Wrapped Bitcoin (WBTC)
$117,475.71 ▲ 0.94%
SUI
Sui (SUI)
$3.45 ▼ -0.83%
XLM
Stellar (XLM)
$0.38960480 ▲ 27.45%
LINK
ChainLink (LINK)
$15.42 ▲ 0.06%
BCH
Bitcoin Cash (BCH)
$531.55 ▲ 2.05%
AVAX
Avalanche (AVAX)
$20.96 ▲ 0.37%
HBAR
Hedera (HBAR)
$0.19933913 ▲ 0.18%
LEO
UNUS SED LEO (LEO)
$9.07 ▲ 0.44%
SHIB
SHIBA INU (SHIB)
$0.00001347 ▼ -0.73%
weETH
Wrapped eETH (weETH)
$3,175.67 ▲ 0.06%
USDS
USDS (USDS)
$0.99998031 ▼ -0.09%
TON
Toncoin (TON)
$3.00 ▲ 0.96%
LTC
Litecoin (LTC)
$95.12 ▼ -0.58%
DOT
Polkadot (DOT)
$3.99 ▲ 1.73%
XMR
Monero (XMR)
$333.22 ▲ 1.45%
PEPE
Pepe (PEPE)
$0.00001249 ▼ -1.22%
BGB
Bitget Token (BGB)
$4.51 ▼ -2.21%
USDe
Ethena USDe (USDe)
$1.00 ▲ 0.00%
UNI
Uniswap (UNI)
$8.79 ▲ 4.15%
AAVE
Aave (AAVE)
$301.54 ▼ -1.97%
DAI
Dai (DAI)
$1.00 ▲ 0.01%
PI
Pi Network (PI)
$0.47152878 ▼ -9.97%
TAO
Bittensor (TAO)
$400.26 ▲ 5.36%
APT
Aptos (APT)
$4.92 ▼ -0.40%
NEAR
Near Protocol (NEAR)
$2.54 ▼ -0.54%
CRO
Cronos (CRO)
$0.10857894 ▲ 11.94%
OKB
OKB (OKB)
$48.98 ▼ -0.79%
ICP
Internet Computer (ICP)
$5.42 ▼ -1.14%
ONDO
Ondo Finance (ONDO)
$0.90277312 ▼ -0.27%
JitoSOL
Jito Staked SOL (JitoSOL)
$198.80 ▼ -0.74%
ETC
Ethereum Classic (ETC)
$18.44 ▼ -0.69%
KAS
Kaspa (KAS)
$0.08705969 ▼ -0.08%
USD1
USD1 (USD1)
$1.00 ▲ 0.01%
ENA
Ethena (ENA)
$0.33731347 ▲ 3.48%
ATOM
Cosmos Hub (ATOM)
$4.69 ▲ 0.72%
VET
VeChain (VET)
$0.02443807 ▲ 0.10%
MNT
Mantle (MNT)
$0.62160691 ▼ -1.68%
POL
POL (ex-MATIC) (POL)
$0.23259061 ▲ 3.26%
ARB
Arbitrum (ARB)
$0.40977977 ▲ 0.00%
TRUMP
OFFICIAL TRUMP (TRUMP)
$9.92 ▼ -2.05%
GT
GateToken (GT)
$16.31 ▲ 0.03%
ALGO
Algorand (ALGO)
$0.22431238 ▲ 2.19%
RENDER
Render (RENDER)
$3.69 ▼ -1.88%
FET
Artificial Superintelligence Alliance (FET)
$0.72380507 ▼ -2.54%
FTN
Fasttoken (FTN)
$4.45 ▼ -0.32%
SEI
Sei (SEI)
$0.33263869 ▼ -0.10%
FIL
Filecoin (FIL)
$2.59 ▼ -0.40%
SKY
Sky (SKY)
$0.07993099 ▼ -5.41%
BONK
Bonk (BONK)
$0.00002262 ▼ -5.97%
MKR
Maker (MKR)
$1,916.45 ▼ -5.18%
WLD
World (WLD)
$1.05 ▼ -3.40%
QNT
Quant (QNT)
$116.47 ▼ -0.27%
SPX
SPX6900 (SPX)
$1.64 ▼ -0.89%
JUP
Jupiter (JUP)
$0.48917509 ▼ -0.58%
FDUSD
First Digital USD (FDUSD)
$0.99830339 ▼ -0.01%
KCS
KuCoin Token (KCS)
$11.49 ▲ 1.08%
TIA
Celestia (TIA)
$1.94 ▲ 2.33%
FORM
Four (FORM)
$3.32 ▲ 6.82%
PENGU
Pudgy Penguins (PENGU)
$0.02364299 ▲ 14.45%
Fartcoin
Fartcoin (Fartcoin)
$1.28 ▼ -3.12%
NEXO
Nexo (NEXO)
$1.28 ▲ 0.47%
INJ
Injective (INJ)
$12.72 ▲ 2.46%
FLR
Flare (FLR)
$0.01716324 ▲ 1.43%
OP
Optimism (OP)
$0.66353681 ▼ -1.77%
XDC
XDC Network (XDC)
$0.07075209 ▼ -3.45%
VIRTUAL
Virtuals Protocol (VIRTUAL)
$1.75 ▼ -2.65%
STX
Stacks (STX)
$0.75189321 ▲ 0.13%
S
Sonic (S)
$0.36329878 ▲ 5.91%
IP
Story Protocol (IP)
$4.76 ▲ 36.51%
mETH
Mantle Staked Ether (mETH)
$3,169.50 ▲ 0.17%
WIF
dogwifhat (WIF)
$0.98061513 ▼ -7.18%
GRT
The Graph (GRT)
$0.09718287 ▼ -1.38%
FLOKI
FLOKI (FLOKI)
$0.00009586 ▼ -7.41%
IMX
Immutable (IMX)
$0.50697224 ▲ 1.62%
PAXG
PAX Gold (PAXG)
$3,350.75 ▲ 0.59%
KAIA
Kaia (KAIA)
$0.16117188 ▼ -0.66%
PYUSD
PayPal USD (PYUSD)
$0.99899888 ▲ 0.06%
CRV
Curve DAO (CRV)
$0.63216553 ▲ 2.79%
CAKE
PancakeSwap (CAKE)
$2.50 ▼ -0.91%
A
Vaulta (A)
$0.54288521 ▼ -0.46%
XAUT
Tether Gold (XAUT)
$3,350.92 ▲ 0.69%
mSOL
Marinade Staked SOL (mSOL)
$214.18 ▼ -0.66%
THETA
Theta Network (THETA)
$0.80069316 ▼ -0.42%
GALA
Gala (GALA)
$0.01733248 ▲ 0.62%
LDO
Lido (LDO)
$0.84417346 ▼ -0.88%
RAY
Raydium (RAY)
$2.71 ▼ -0.71%
IOTA
IOTA (IOTA)
$0.19456379 ▲ 5.80%
IOTA
IOTA (IOTA)
$0.19456379 ▲ 5.80%
to-top

Can Solana price break $90 resistance as it forms a bullish channel?

Solana is trading within an ascending channel, with $90 capping its upside over the past week and acting as a key breakout level. According to data from crypto.news, Solana (SOL) dropped from its Wednesday high of $89 to $85 on…

Solana is trading within an ascending channel, with $90 capping its upside over the past week and acting as a key breakout level.

Summary
  • Solana trades within an ascending channel, with $90 acting as a key resistance level that has capped upside for nearly a week.
  • Price has stabilized in the $85–$86 range after dropping from $89, while technical indicators point to building bullish momentum.
  • A breakout above $90 could open upside toward $94–$96, while rejection may lead to a retest of the $80 support zone.

According to data from crypto.news, Solana (SOL) dropped from its Wednesday high of $89 to $85 on Thursday. The token has since stabilized and has been trading within a tight range of $85–$86 as bulls fail to reclaim the $90 resistance level for nearly a week.

Despite recent weakness, technical indicators suggest that Solana price is well-positioned to surge past $90 in the coming sessions.

On the daily chart, Solana price has formed an ascending channel pattern, marked by higher lows and higher highs. The pattern signals a steady accumulation trend where buyers step in at increasingly higher levels.

Solana price has formed an ascending parallel channel pattern on the daily chart.
Solana price has formed an ascending parallel channel pattern on the daily chart — April 24 | Source: crypto.news

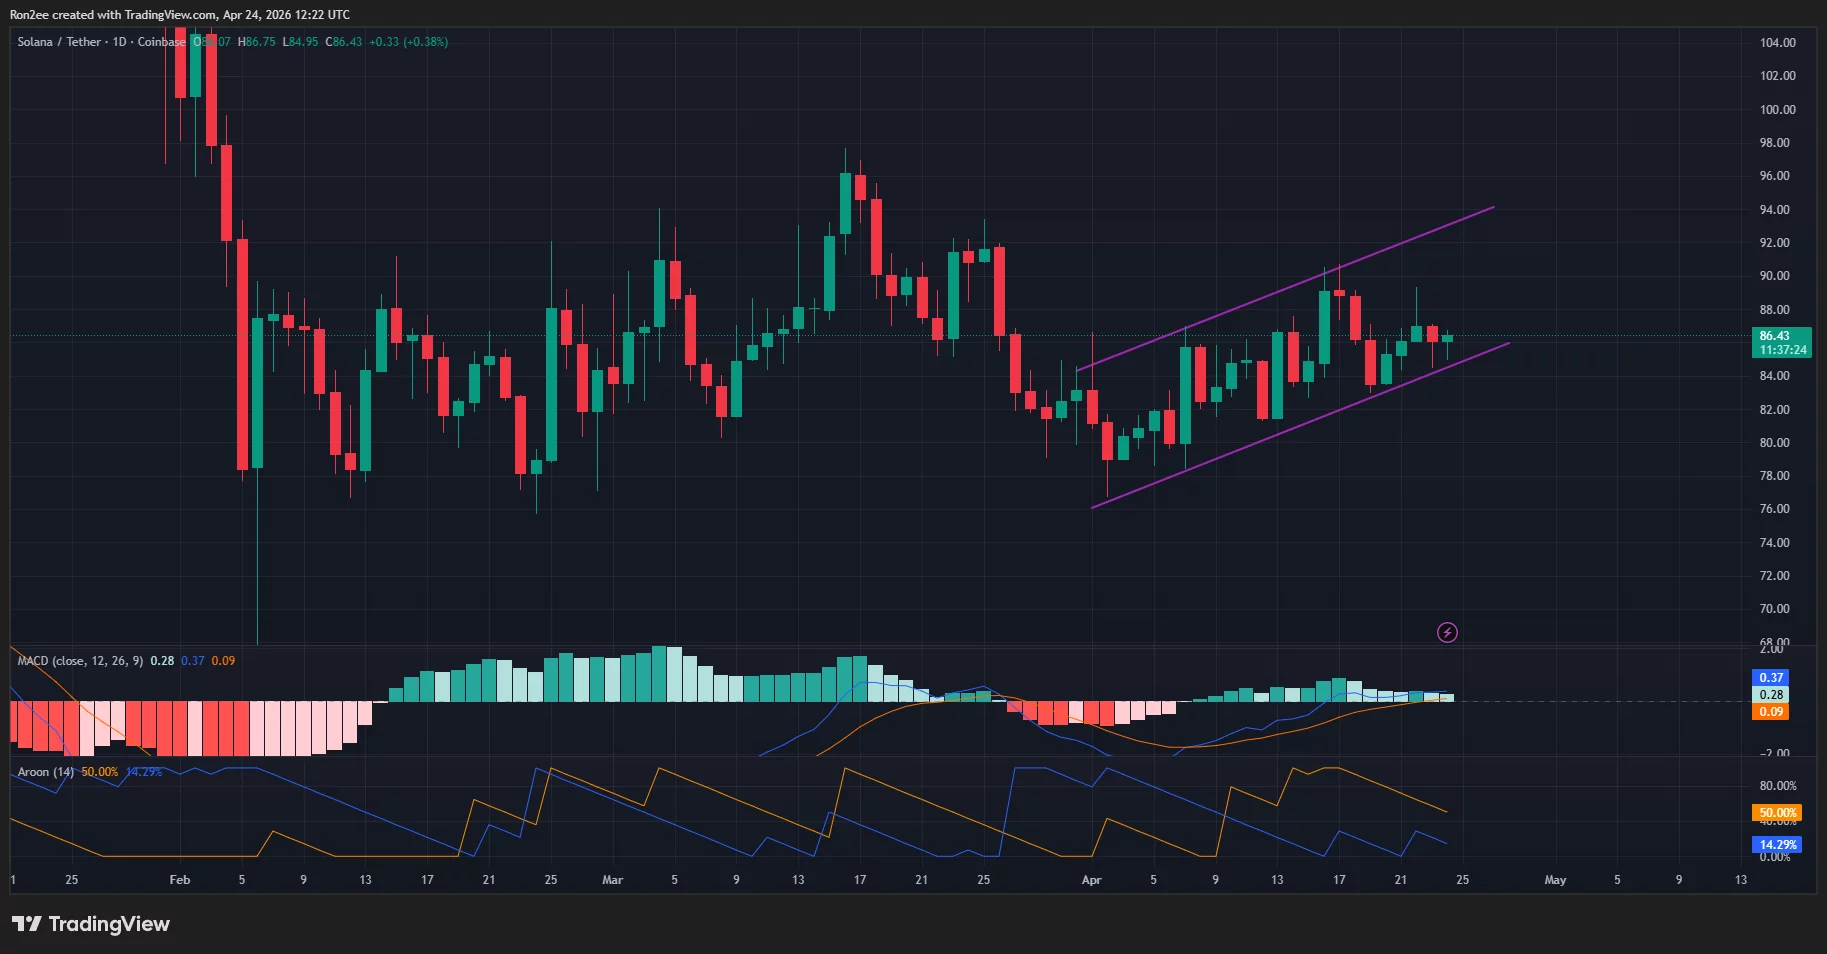
In Solana’s case, the lower boundary of the channel sits near the $78–$80 zone, which has acted as strong support, while the upper boundary continues to converge toward the $90 resistance area.

Momentum indicators also seem to support a gradual….to the bulls. The MACD histogram has turned positive, with the signal line crossing above the MACD line. At the same time, the Aroon indicator shows the Aroon Up trending higher while Aroon Down remains subdued, a sign that buying pressure is starting to dominate over sellers.

Hence, if Solana price manages a decisive breakout above the $90 resistance level, it could confirm the continuation of the ascending channel and open the door for further upside toward the $94–$96 region, where the next supply zone remains visible.

However, failure to break above the $90 resistance could keep the price confined within the channel, with a potential retest of the $80 support level if selling pressure increases.

Disclosure: This article does not represent investment advice. The content and materials featured on this page are for educational purposes only.