BTC
Bitcoin (BTC)
$117,693.80 ▲ 0.99%
ETH
Ethereum (ETH)
$2,963.44 ▲ 0.01%
XRP
XRP (XRP)
$2.81 ▲ 8.65%
USDT
Tether (USDT)
$1.00 ▲ 0.02%
BNB
BNB (BNB)
$693.84 ▲ 0.56%
SOL
Solana (SOL)
$163.39 ▼ -0.95%
USDC
USDC (USDC)
$0.99994157 ▲ 0.01%
DOGE
Dogecoin (DOGE)
$0.20496293 ▲ 3.41%
TRX
TRON (TRX)
$0.30485666 ▲ 3.39%
ADA
Cardano (ADA)
$0.73343688 ▲ 6.53%
stETH
Lido Staked Ether (stETH)
$2,963.31 ▲ 0.12%
HYPE
Hyperliquid (HYPE)
$46.42 ▲ 5.24%
WBTC
Wrapped Bitcoin (WBTC)
$117,475.71 ▲ 0.94%
SUI
Sui (SUI)
$3.45 ▼ -0.83%
XLM
Stellar (XLM)
$0.38960480 ▲ 27.45%
LINK
ChainLink (LINK)
$15.42 ▲ 0.06%
BCH
Bitcoin Cash (BCH)
$531.55 ▲ 2.05%
AVAX
Avalanche (AVAX)
$20.96 ▲ 0.37%
HBAR
Hedera (HBAR)
$0.19933913 ▲ 0.18%
LEO
UNUS SED LEO (LEO)
$9.07 ▲ 0.44%
SHIB
SHIBA INU (SHIB)
$0.00001347 ▼ -0.73%
weETH
Wrapped eETH (weETH)
$3,175.67 ▲ 0.06%
USDS
USDS (USDS)
$0.99998031 ▼ -0.09%
TON
Toncoin (TON)
$3.00 ▲ 0.96%
LTC
Litecoin (LTC)
$95.12 ▼ -0.58%
DOT
Polkadot (DOT)
$3.99 ▲ 1.73%
XMR
Monero (XMR)
$333.22 ▲ 1.45%
PEPE
Pepe (PEPE)
$0.00001249 ▼ -1.22%
BGB
Bitget Token (BGB)
$4.51 ▼ -2.21%
USDe
Ethena USDe (USDe)
$1.00 ▲ 0.00%
UNI
Uniswap (UNI)
$8.79 ▲ 4.15%
AAVE
Aave (AAVE)
$301.54 ▼ -1.97%
DAI
Dai (DAI)
$1.00 ▲ 0.01%
PI
Pi Network (PI)
$0.47152878 ▼ -9.97%
TAO
Bittensor (TAO)
$400.26 ▲ 5.36%
APT
Aptos (APT)
$4.92 ▼ -0.40%
NEAR
Near Protocol (NEAR)
$2.54 ▼ -0.54%
CRO
Cronos (CRO)
$0.10857894 ▲ 11.94%
OKB
OKB (OKB)
$48.98 ▼ -0.79%
ICP
Internet Computer (ICP)
$5.42 ▼ -1.14%
ONDO
Ondo Finance (ONDO)
$0.90277312 ▼ -0.27%
JitoSOL
Jito Staked SOL (JitoSOL)
$198.80 ▼ -0.74%
ETC
Ethereum Classic (ETC)
$18.44 ▼ -0.69%
KAS
Kaspa (KAS)
$0.08705969 ▼ -0.08%
USD1
USD1 (USD1)
$1.00 ▲ 0.01%
ENA
Ethena (ENA)
$0.33731347 ▲ 3.48%
ATOM
Cosmos Hub (ATOM)
$4.69 ▲ 0.72%
VET
VeChain (VET)
$0.02443807 ▲ 0.10%
MNT
Mantle (MNT)
$0.62160691 ▼ -1.68%
POL
POL (ex-MATIC) (POL)
$0.23259061 ▲ 3.26%
ARB
Arbitrum (ARB)
$0.40977977 ▲ 0.00%
TRUMP
OFFICIAL TRUMP (TRUMP)
$9.92 ▼ -2.05%
GT
GateToken (GT)
$16.31 ▲ 0.03%
ALGO
Algorand (ALGO)
$0.22431238 ▲ 2.19%
RENDER
Render (RENDER)
$3.69 ▼ -1.88%
FET
Artificial Superintelligence Alliance (FET)
$0.72380507 ▼ -2.54%
FTN
Fasttoken (FTN)
$4.45 ▼ -0.32%
SEI
Sei (SEI)
$0.33263869 ▼ -0.10%
FIL
Filecoin (FIL)
$2.59 ▼ -0.40%
SKY
Sky (SKY)
$0.07993099 ▼ -5.41%
BONK
Bonk (BONK)
$0.00002262 ▼ -5.97%
MKR
Maker (MKR)
$1,916.45 ▼ -5.18%
WLD
World (WLD)
$1.05 ▼ -3.40%
QNT
Quant (QNT)
$116.47 ▼ -0.27%
SPX
SPX6900 (SPX)
$1.64 ▼ -0.89%
JUP
Jupiter (JUP)
$0.48917509 ▼ -0.58%
FDUSD
First Digital USD (FDUSD)
$0.99830339 ▼ -0.01%
KCS
KuCoin Token (KCS)
$11.49 ▲ 1.08%
TIA
Celestia (TIA)
$1.94 ▲ 2.33%
FORM
Four (FORM)
$3.32 ▲ 6.82%
PENGU
Pudgy Penguins (PENGU)
$0.02364299 ▲ 14.45%
Fartcoin
Fartcoin (Fartcoin)
$1.28 ▼ -3.12%
NEXO
Nexo (NEXO)
$1.28 ▲ 0.47%
INJ
Injective (INJ)
$12.72 ▲ 2.46%
FLR
Flare (FLR)
$0.01716324 ▲ 1.43%
OP
Optimism (OP)
$0.66353681 ▼ -1.77%
XDC
XDC Network (XDC)
$0.07075209 ▼ -3.45%
VIRTUAL
Virtuals Protocol (VIRTUAL)
$1.75 ▼ -2.65%
STX
Stacks (STX)
$0.75189321 ▲ 0.13%
S
Sonic (S)
$0.36329878 ▲ 5.91%
IP
Story Protocol (IP)
$4.76 ▲ 36.51%
mETH
Mantle Staked Ether (mETH)
$3,169.50 ▲ 0.17%
WIF
dogwifhat (WIF)
$0.98061513 ▼ -7.18%
GRT
The Graph (GRT)
$0.09718287 ▼ -1.38%
FLOKI
FLOKI (FLOKI)
$0.00009586 ▼ -7.41%
IMX
Immutable (IMX)
$0.50697224 ▲ 1.62%
PAXG
PAX Gold (PAXG)
$3,350.75 ▲ 0.59%
KAIA
Kaia (KAIA)
$0.16117188 ▼ -0.66%
PYUSD
PayPal USD (PYUSD)
$0.99899888 ▲ 0.06%
CRV
Curve DAO (CRV)
$0.63216553 ▲ 2.79%
CAKE
PancakeSwap (CAKE)
$2.50 ▼ -0.91%
A
Vaulta (A)
$0.54288521 ▼ -0.46%
XAUT
Tether Gold (XAUT)
$3,350.92 ▲ 0.69%
mSOL
Marinade Staked SOL (mSOL)
$214.18 ▼ -0.66%
THETA
Theta Network (THETA)
$0.80069316 ▼ -0.42%
GALA
Gala (GALA)
$0.01733248 ▲ 0.62%
LDO
Lido (LDO)
$0.84417346 ▼ -0.88%
RAY
Raydium (RAY)
$2.71 ▼ -0.71%
IOTA
IOTA (IOTA)
$0.19456379 ▲ 5.80%
IOTA
IOTA (IOTA)
$0.19456379 ▲ 5.80%
to-top

Ethereum price outlook: Buy/sell ratio signals potential pivot

Ethereum price trades near $1,950 as the Binance buy/sell ratio hints at a potential shift in derivatives positioning. Ethereum (ETH) trades at $1,947 at press time, down 4% in the past 24 hours. Price is sitting near the bottom of…

Ethereum price trades near $1,950 as the Binance buy/sell ratio hints at a potential shift in derivatives positioning.

Summary
  • Ethereum price sits near the lower end of its weekly range after a sharp monthly decline.
  • Binance Taker Buy/Sell Ratio has climbed toward neutral after weeks of sell-side pressure.
  • A move above $2,200 is needed to challenge the current downtrend structure.

Ethereum (ETH) trades at $1,947 at press time, down 4% in the past 24 hours. Price is sitting near the bottom of its seven-day range of $1,815.54 to $2,099.16. Over the last month, ETH has fallen 35%, and it is still roughly 60% below its August all-time high of $4,946.

Daily trading volume came in at $22.5 billion, down 25% from the previous session. Participation has thinned as the market drifts sideways near recent lows, with traders appearing cautious rather than aggressive.

Binance taker buy/sell ratio shows early improvement

A Feb. 27 report from CryptoQuant contributor Darkfost focused on Ethereum’s Taker Buy/Sell Ratio on Binance. This metric tracks whether aggressive futures orders are dominated by buyers or sellers.

When the ratio pushes above 1, market buys outweigh market sells. When it stays below 1, sellers are pressing harder.

During Ethereum’s push toward prior highs, the ratio stayed under that equilibrium level. The monthly reading slipped to 0.95, while the weekly average dropped further to 0.92. At the same time, price began to roll over. Persistent futures selling added weight to the move lower.

With derivatives volume hovering around $65 billion, futures flows carry significant influence over price discovery. Heavy sell-side pressure in that market often feeds into spot weakness.

Over the past two weeks, the picture has started to shift. The weekly ratio has hovered near 1.0, and there have been several daily spikes above 1.12, reflecting bursts of aggressive buying. The monthly figure has edged up to around 0.99.

ETH has not staged a decisive rebound yet, but the imbalance seen earlier is less extreme. If the ratio can hold above 1 for a sustained stretch, it would show that buyers are taking control of short-term futures positioning. That kind of shift can lay the groundwork for price stabilization.

Ethereum price technical analysis

On the chart, the trend still favors the downside. Ethereum has printed a series of lower highs and lower lows since breaking down from the $3,000–$3,200 area.

-
ETH daily chart. Credit: crypto.news

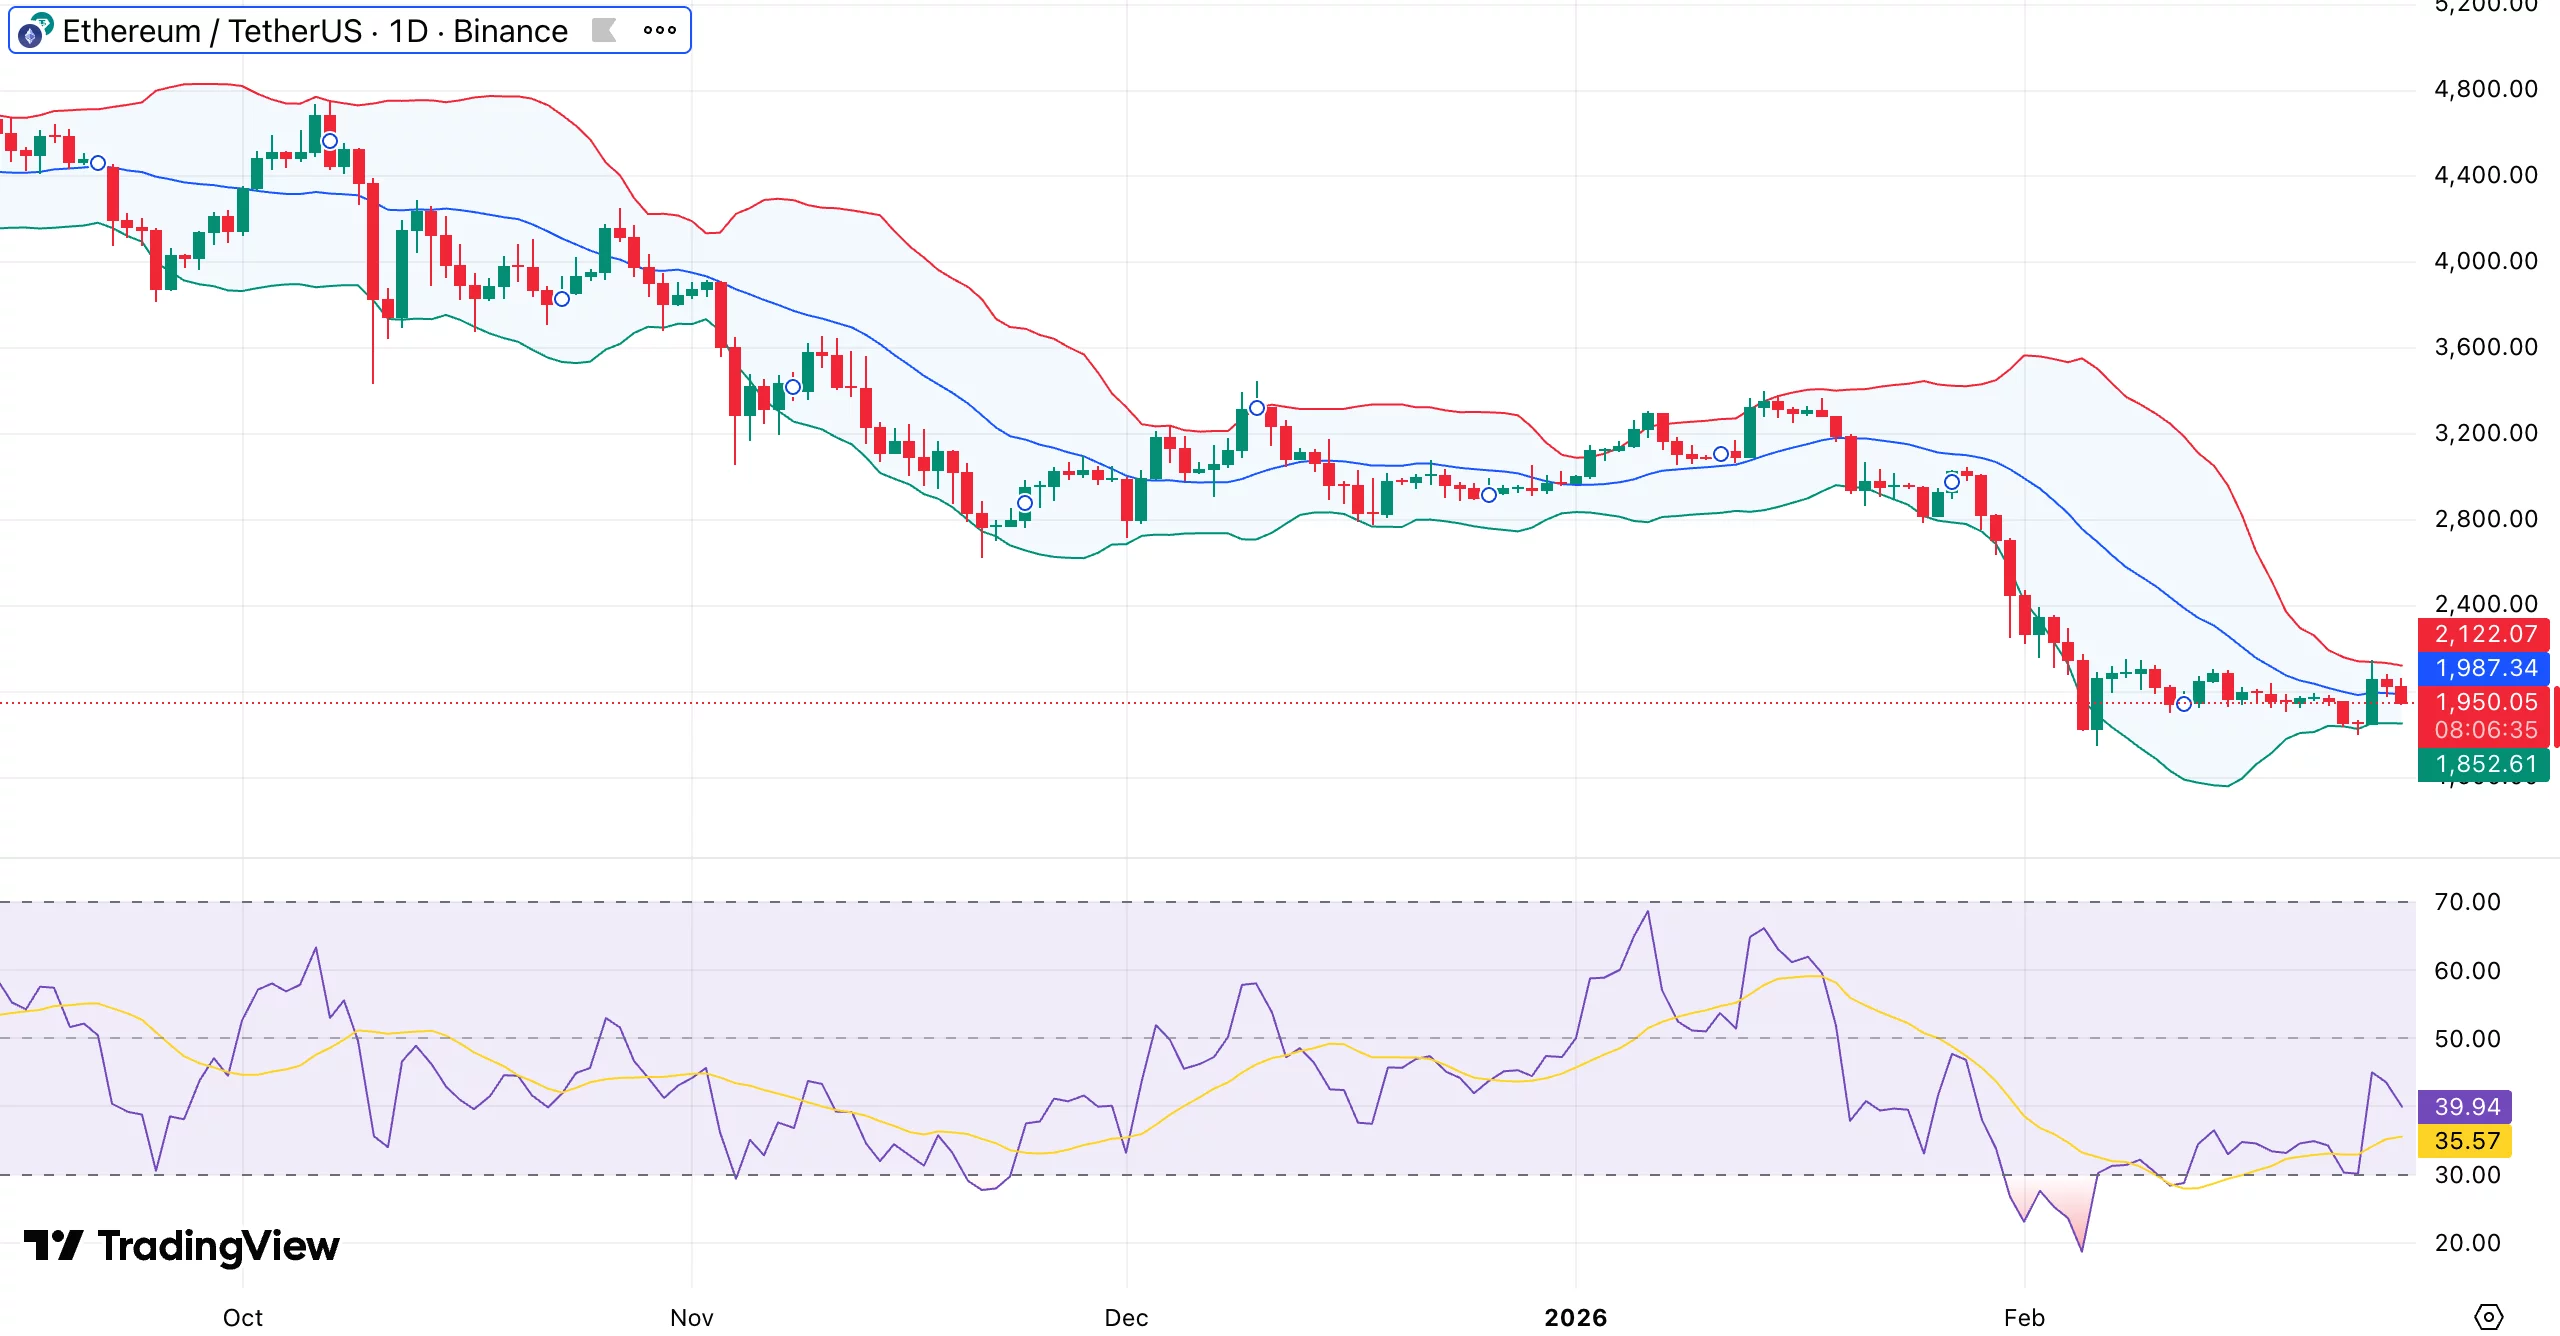
Price is now compressing between roughly $1,950 and $2,000. A higher high has not formed, and until ETH climbs through the $2,200–$2,300 region, the larger structure tilts bearish.

Bollinger Bands widened sharply during the drop as price pierced the lower band near $1,850. That expansion reflected a spike in volatility.

The bands have begun to narrow, pointing to a cooling phase. ETH trades below the middle band, currently around $1,980–$2,000, which is acting as near-term resistance.

The relative strength index fell into the 25–30 zone during the selloff, deep in oversold territory. It has recovered to around 40. Momentum has improved slightly, yet buyers have not regained full control. A push above 50 would strengthen the case for a more durable bounce.

Support lies between $1,850 and $1,880. If that floor gives way, the next area to watch sits near $1,700–$1,750. On the upside, $2,000 is the first barrier, followed by stronger resistance between $2,120 and $2,200.