BTC
Bitcoin (BTC)
$117,693.80 ▲ 0.99%
ETH
Ethereum (ETH)
$2,963.44 ▲ 0.01%
XRP
XRP (XRP)
$2.81 ▲ 8.65%
USDT
Tether (USDT)
$1.00 ▲ 0.02%
BNB
BNB (BNB)
$693.84 ▲ 0.56%
SOL
Solana (SOL)
$163.39 ▼ -0.95%
USDC
USDC (USDC)
$0.99994157 ▲ 0.01%
DOGE
Dogecoin (DOGE)
$0.20496293 ▲ 3.41%
TRX
TRON (TRX)
$0.30485666 ▲ 3.39%
ADA
Cardano (ADA)
$0.73343688 ▲ 6.53%
stETH
Lido Staked Ether (stETH)
$2,963.31 ▲ 0.12%
HYPE
Hyperliquid (HYPE)
$46.42 ▲ 5.24%
WBTC
Wrapped Bitcoin (WBTC)
$117,475.71 ▲ 0.94%
SUI
Sui (SUI)
$3.45 ▼ -0.83%
XLM
Stellar (XLM)
$0.38960480 ▲ 27.45%
LINK
ChainLink (LINK)
$15.42 ▲ 0.06%
BCH
Bitcoin Cash (BCH)
$531.55 ▲ 2.05%
AVAX
Avalanche (AVAX)
$20.96 ▲ 0.37%
HBAR
Hedera (HBAR)
$0.19933913 ▲ 0.18%
LEO
UNUS SED LEO (LEO)
$9.07 ▲ 0.44%
SHIB
SHIBA INU (SHIB)
$0.00001347 ▼ -0.73%
weETH
Wrapped eETH (weETH)
$3,175.67 ▲ 0.06%
USDS
USDS (USDS)
$0.99998031 ▼ -0.09%
TON
Toncoin (TON)
$3.00 ▲ 0.96%
LTC
Litecoin (LTC)
$95.12 ▼ -0.58%
DOT
Polkadot (DOT)
$3.99 ▲ 1.73%
XMR
Monero (XMR)
$333.22 ▲ 1.45%
PEPE
Pepe (PEPE)
$0.00001249 ▼ -1.22%
BGB
Bitget Token (BGB)
$4.51 ▼ -2.21%
USDe
Ethena USDe (USDe)
$1.00 ▲ 0.00%
UNI
Uniswap (UNI)
$8.79 ▲ 4.15%
AAVE
Aave (AAVE)
$301.54 ▼ -1.97%
DAI
Dai (DAI)
$1.00 ▲ 0.01%
PI
Pi Network (PI)
$0.47152878 ▼ -9.97%
TAO
Bittensor (TAO)
$400.26 ▲ 5.36%
APT
Aptos (APT)
$4.92 ▼ -0.40%
NEAR
Near Protocol (NEAR)
$2.54 ▼ -0.54%
CRO
Cronos (CRO)
$0.10857894 ▲ 11.94%
OKB
OKB (OKB)
$48.98 ▼ -0.79%
ICP
Internet Computer (ICP)
$5.42 ▼ -1.14%
ONDO
Ondo Finance (ONDO)
$0.90277312 ▼ -0.27%
JitoSOL
Jito Staked SOL (JitoSOL)
$198.80 ▼ -0.74%
ETC
Ethereum Classic (ETC)
$18.44 ▼ -0.69%
KAS
Kaspa (KAS)
$0.08705969 ▼ -0.08%
USD1
USD1 (USD1)
$1.00 ▲ 0.01%
ENA
Ethena (ENA)
$0.33731347 ▲ 3.48%
ATOM
Cosmos Hub (ATOM)
$4.69 ▲ 0.72%
VET
VeChain (VET)
$0.02443807 ▲ 0.10%
MNT
Mantle (MNT)
$0.62160691 ▼ -1.68%
POL
POL (ex-MATIC) (POL)
$0.23259061 ▲ 3.26%
ARB
Arbitrum (ARB)
$0.40977977 ▲ 0.00%
TRUMP
OFFICIAL TRUMP (TRUMP)
$9.92 ▼ -2.05%
GT
GateToken (GT)
$16.31 ▲ 0.03%
ALGO
Algorand (ALGO)
$0.22431238 ▲ 2.19%
RENDER
Render (RENDER)
$3.69 ▼ -1.88%
FET
Artificial Superintelligence Alliance (FET)
$0.72380507 ▼ -2.54%
FTN
Fasttoken (FTN)
$4.45 ▼ -0.32%
SEI
Sei (SEI)
$0.33263869 ▼ -0.10%
FIL
Filecoin (FIL)
$2.59 ▼ -0.40%
SKY
Sky (SKY)
$0.07993099 ▼ -5.41%
BONK
Bonk (BONK)
$0.00002262 ▼ -5.97%
MKR
Maker (MKR)
$1,916.45 ▼ -5.18%
WLD
World (WLD)
$1.05 ▼ -3.40%
QNT
Quant (QNT)
$116.47 ▼ -0.27%
SPX
SPX6900 (SPX)
$1.64 ▼ -0.89%
JUP
Jupiter (JUP)
$0.48917509 ▼ -0.58%
FDUSD
First Digital USD (FDUSD)
$0.99830339 ▼ -0.01%
KCS
KuCoin Token (KCS)
$11.49 ▲ 1.08%
TIA
Celestia (TIA)
$1.94 ▲ 2.33%
FORM
Four (FORM)
$3.32 ▲ 6.82%
PENGU
Pudgy Penguins (PENGU)
$0.02364299 ▲ 14.45%
Fartcoin
Fartcoin (Fartcoin)
$1.28 ▼ -3.12%
NEXO
Nexo (NEXO)
$1.28 ▲ 0.47%
INJ
Injective (INJ)
$12.72 ▲ 2.46%
FLR
Flare (FLR)
$0.01716324 ▲ 1.43%
OP
Optimism (OP)
$0.66353681 ▼ -1.77%
XDC
XDC Network (XDC)
$0.07075209 ▼ -3.45%
VIRTUAL
Virtuals Protocol (VIRTUAL)
$1.75 ▼ -2.65%
STX
Stacks (STX)
$0.75189321 ▲ 0.13%
S
Sonic (S)
$0.36329878 ▲ 5.91%
IP
Story Protocol (IP)
$4.76 ▲ 36.51%
mETH
Mantle Staked Ether (mETH)
$3,169.50 ▲ 0.17%
WIF
dogwifhat (WIF)
$0.98061513 ▼ -7.18%
GRT
The Graph (GRT)
$0.09718287 ▼ -1.38%
FLOKI
FLOKI (FLOKI)
$0.00009586 ▼ -7.41%
IMX
Immutable (IMX)
$0.50697224 ▲ 1.62%
PAXG
PAX Gold (PAXG)
$3,350.75 ▲ 0.59%
KAIA
Kaia (KAIA)
$0.16117188 ▼ -0.66%
PYUSD
PayPal USD (PYUSD)
$0.99899888 ▲ 0.06%
CRV
Curve DAO (CRV)
$0.63216553 ▲ 2.79%
CAKE
PancakeSwap (CAKE)
$2.50 ▼ -0.91%
A
Vaulta (A)
$0.54288521 ▼ -0.46%
XAUT
Tether Gold (XAUT)
$3,350.92 ▲ 0.69%
mSOL
Marinade Staked SOL (mSOL)
$214.18 ▼ -0.66%
THETA
Theta Network (THETA)
$0.80069316 ▼ -0.42%
GALA
Gala (GALA)
$0.01733248 ▲ 0.62%
LDO
Lido (LDO)
$0.84417346 ▼ -0.88%
RAY
Raydium (RAY)
$2.71 ▼ -0.71%
IOTA
IOTA (IOTA)
$0.19456379 ▲ 5.80%
IOTA
IOTA (IOTA)
$0.19456379 ▲ 5.80%
to-top

Will MSTR stock recover as Saylor’s Strategy buys 8,178 Bitcoins?

Strategy, which trades under the ticker symbol MSTR, saw its stock price gap lower on Monday as Bitcoin continued its strong downward trend and as the company continued its buying spree. Strategy stock dropped to $192, its lowest level since…

Strategy, which trades under the ticker symbol MSTR, saw its stock price gap lower on Monday as Bitcoin continued its strong downward trend and as the company continued its buying spree.

Summary
  • MSTR stock price retreated to its lowest level since October 14.
  • Bitcoin price crashed and formed a death cross pattern on the daily chart.
  • Strategy bought 8,178 Bitcoins last week as the price crashed.

Strategy stock dropped to $192, its lowest level since October last year, and 57% below its highest level this year. This crash has led to a $72 billion wipeout, with the market capitalization dropping from $128 billion in August to $57 billion today. 

Strategy, formerly known as MicroStrategy, continued its Bitcoin (BTC) buying spree last week, a sign that Michael Saylor believes that the coin will rebound. 

He bought 8,178 coins valued at over $835 million, bringing his total hoard to 649,870. Its total holdings are now valued at over $61.7 billion. It is still profitable, as its average purchase price was $48 billion. 

In an appearance on CNBC last week, Saylor maintained that the Bitcoin price has more room to run, citing its strong fundamentals, including the rising institutional demand and the falling supply. He also noted that the ongoing volatility was part of the game, pointing to past drawdowns.

Saylor believes the ongoing Bitcoin price retreat is due to investor deleveraging, as evidenced by falling futures open interest. Bitcoin’s daily open interest has dropped to $64 billion from the October high of $94 billion.

Saylor believes that Bitcoin price will outperform gold and the S&P 500 Index over time, calling it a digital capital with a limited supply and strong demand.

Strategy’s acquisition happened as the company’s market Net Asset Value (mNAV) has plunged in the past few months. Its mNAV has crashed to 0.94 from the year-to-date high of over 3.

MSTR stock price technical analysis 

MSTR stock
Strategy stock chart | Source: crypto.news

The MSTR stock will likely remain under pressure in the near term now that the Bitcoin price has formed a death cross pattern as the 50-day Exponential Moving Average has dropped below the 200-day average.

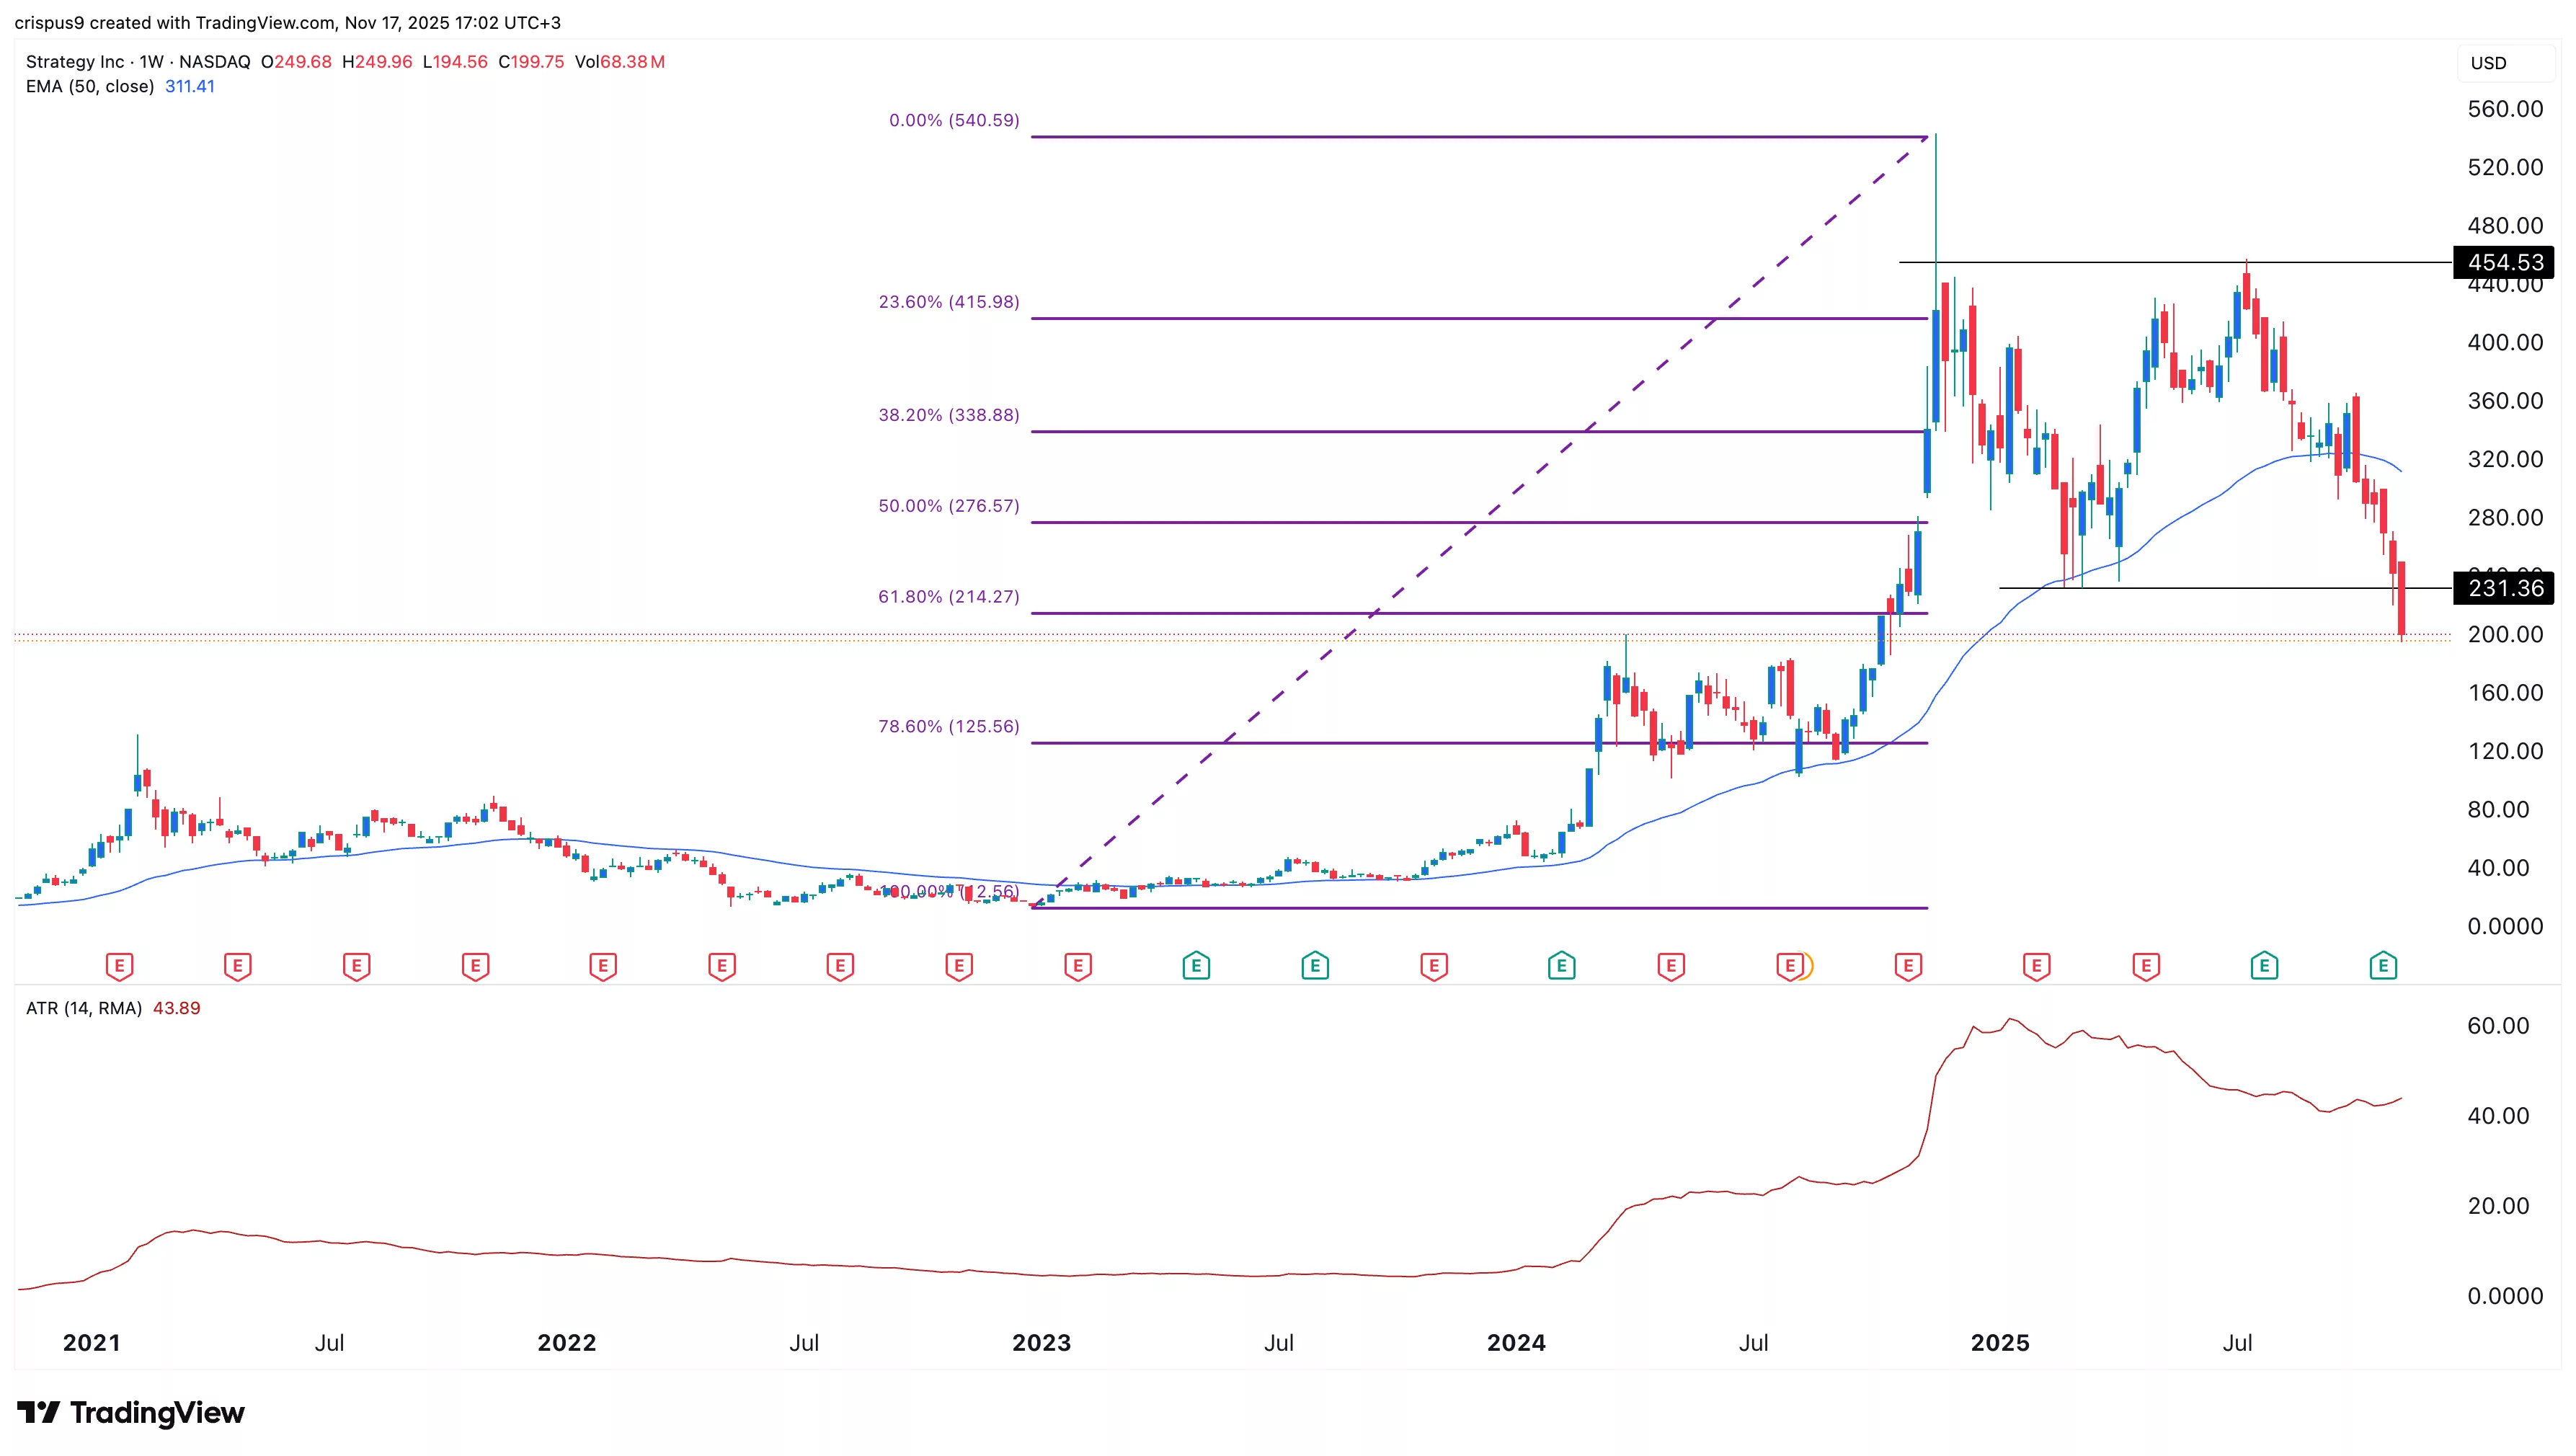
The weekly timeframe chart shows that the MSTR stock price remains under intense pressure. It formed a double-top pattern at $455 and a neckline at $231, its lowest level in February.

Strategy stock has plunged below the important 61.8% Fibonacci Retracement level at $214, confirming the bearish outlook.

Also, the Average Directional Index (ADX) has remained above 40, a sign that the downtrend is continuing. Therefore, the stock will likely continue falling as bears target the 78.6% retracement level at $125. 

The bearish MSTR stock price will become invalid if it moves above the important resistance level at $230. A move above that level will point to more upside in the near term.